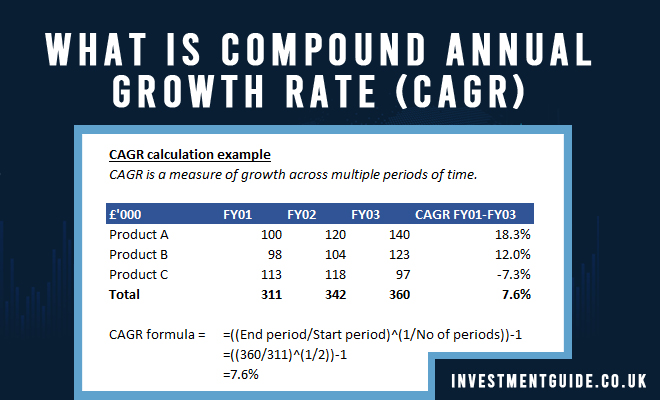
Compound annual growth rate (‘CAGR’) is a measure of growth (in percentage terms) from one period to another.
It is a very useful metric when looking at investment growth over time, or when comparing forecast growth rates to historical trends during due diligence. For example, if 15% revenue growth is forecast compared with 4% CAGR historically, this is an indicator that the forecast may be fairly challenging.
CAGR is measured in percentage terms. Whilst revenue might have fluctuated between Y1, Y2 and Y3 (e.g. from £400k Y1, to £375k in Y2 and £500k in Y3), CAGR represents the consistent return % required to take you from £400k in the first period to £500k in the third period.
Using CAGR to analyse revenue growth – example calculation
CAGR is calculated using the Excel formula =((End period/Start period)^(1/No of periods))-1.
Looking at the above example, to find the CAGR of total revenue between FY01 and FY03, you would use the formula =((FY03 Revenue/FY01 Revenue)^(1/2))-1.
Note that between FY01 and FY03, there are 2 periods. A common mistake when calculating CAGR is to use the incorrect number of periods. FY01 to FY02 is one period, whilst FY02 to FY03 is another. The CAGR is calculated as =((360/311)^(1/2))-1 = 7.6%.
Using CAGR to evaluate investment performance
The important thing to remember is that CAGR provides an annual rate of return assuming that profits are reinvested at the end of each year.
Using CAGR to evaluate investments can be useful high level representation of growth over time for singular investments.
However, it is limited in that:
- It ignores any fluctuations in investment value (as noted in the revenue example above)
- It struggles to deal with any incremental investments made throughout the period. If you start with £10,000 invested at the start of the year, and then invest a further £5000 after six months, if you calculated a CAGR at the end of the year, it would be inflated because of the capital injection. For the CAGR percentage to mean anything, you would need to separate the two investments and view them separately.
- Comparing CAGR %’s across different forms of investment does not consider the varying levels of risk or volatility. For example, CAGR % on an instant saver bank account may be lower than the return on a FTSE 100 tracker, but the tracker is subject to greater risk and volatility.
CAGR can also be used by investors to determine what rate of return would be required to obtain the desired return on their investment over a period of time. For instance, if you have £10,000 today and expect that to turn into £100,000 over 15 years, you would require a 16.6% CAGR (=((100,000/10,000)^(1/10))-1).
Using CAGR to calculate a return over months or days
Calculating a CAGR % where you do not have a perfect holding period consisting of a set number of years is easy. You simply need to convert the holding period into years.
For example, let’s consider an investor who wants to acquire shares for £10,000 on 1st March 2XX1 and hopes that they will be worth £12,500 on 31st December 2XX2.
CAGR using days
The holding period in 2XX1 would be 306 (365-59) whilst the holding period in 2XX2 would be 365.
The total number of days would be 671. Divide 671 by 365 to get 1.83 periods.
The CAGR calculation would therefore be =((12,500/10,000)^(1/1.83))-1 = 13.0%.
CAGR using months
When the holding period starts and ends at the start/end of a month, you can use months to calculate the CAGR %. For example, using the same example noted above, the holding period in 2XX1 would be 10 months whilst the holding period in 2XX2 would be 12 months.
The total number of months would be 22. Divide 22 by 12 to get 1.83 periods. The CAGR calculation would therefore be the same as above.


